HBAR Price Dips: Technical Signals Suggest Potential Downturn
HBAR Price Correction: A Technical Analysis
Hedera's native token, HBAR, experienced a 5% increase over the past week, fueled by rising investor interest and a broader altcoin market upswing. However, a closer look at technical indicators reveals a potentially weakening bullish trend, hinting at a possible price pullback.
Weakening Bullish Pressure: EMA and Elder-Ray Index
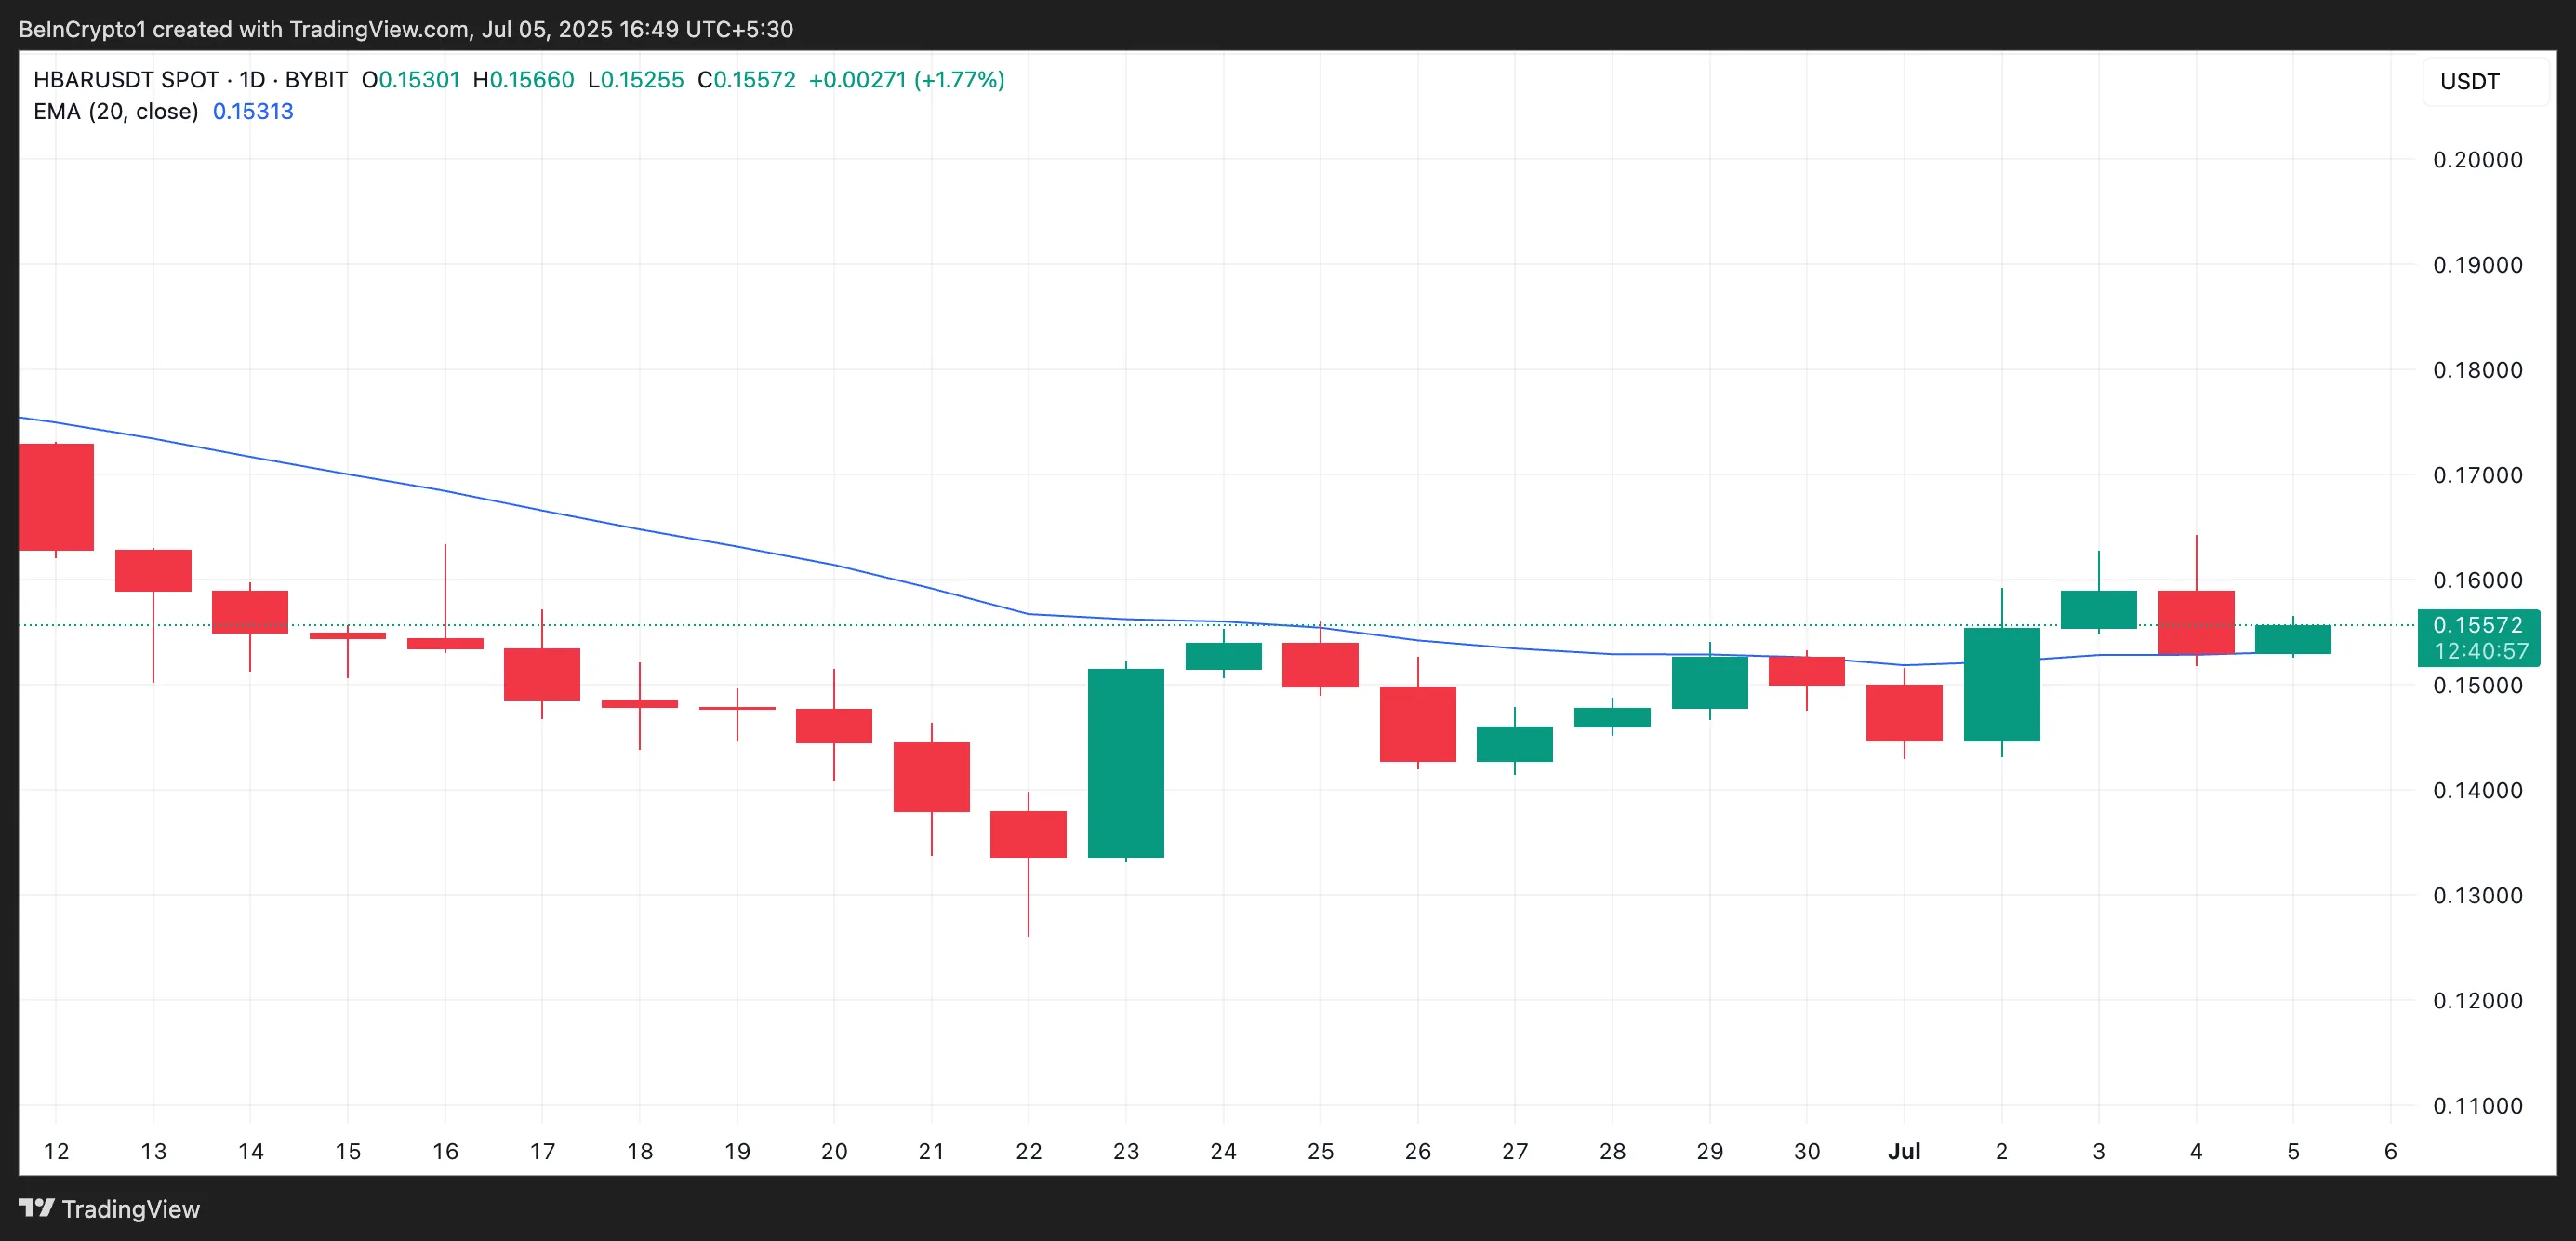
Analyzing the HBAR/USD daily chart, we observe HBAR testing a break below its 20-day Exponential Moving Average (EMA). Currently trading around $0.155, it's holding above the EMA's dynamic support at $0.153. A sustained break below this EMA would strongly indicate weakening short-term momentum.
Further supporting a bearish outlook, the Elder-Ray Index shows shrinking green bars over the past three trading sessions. This contraction signifies diminishing bullish conviction and increases the likelihood of a near-term price reversal.
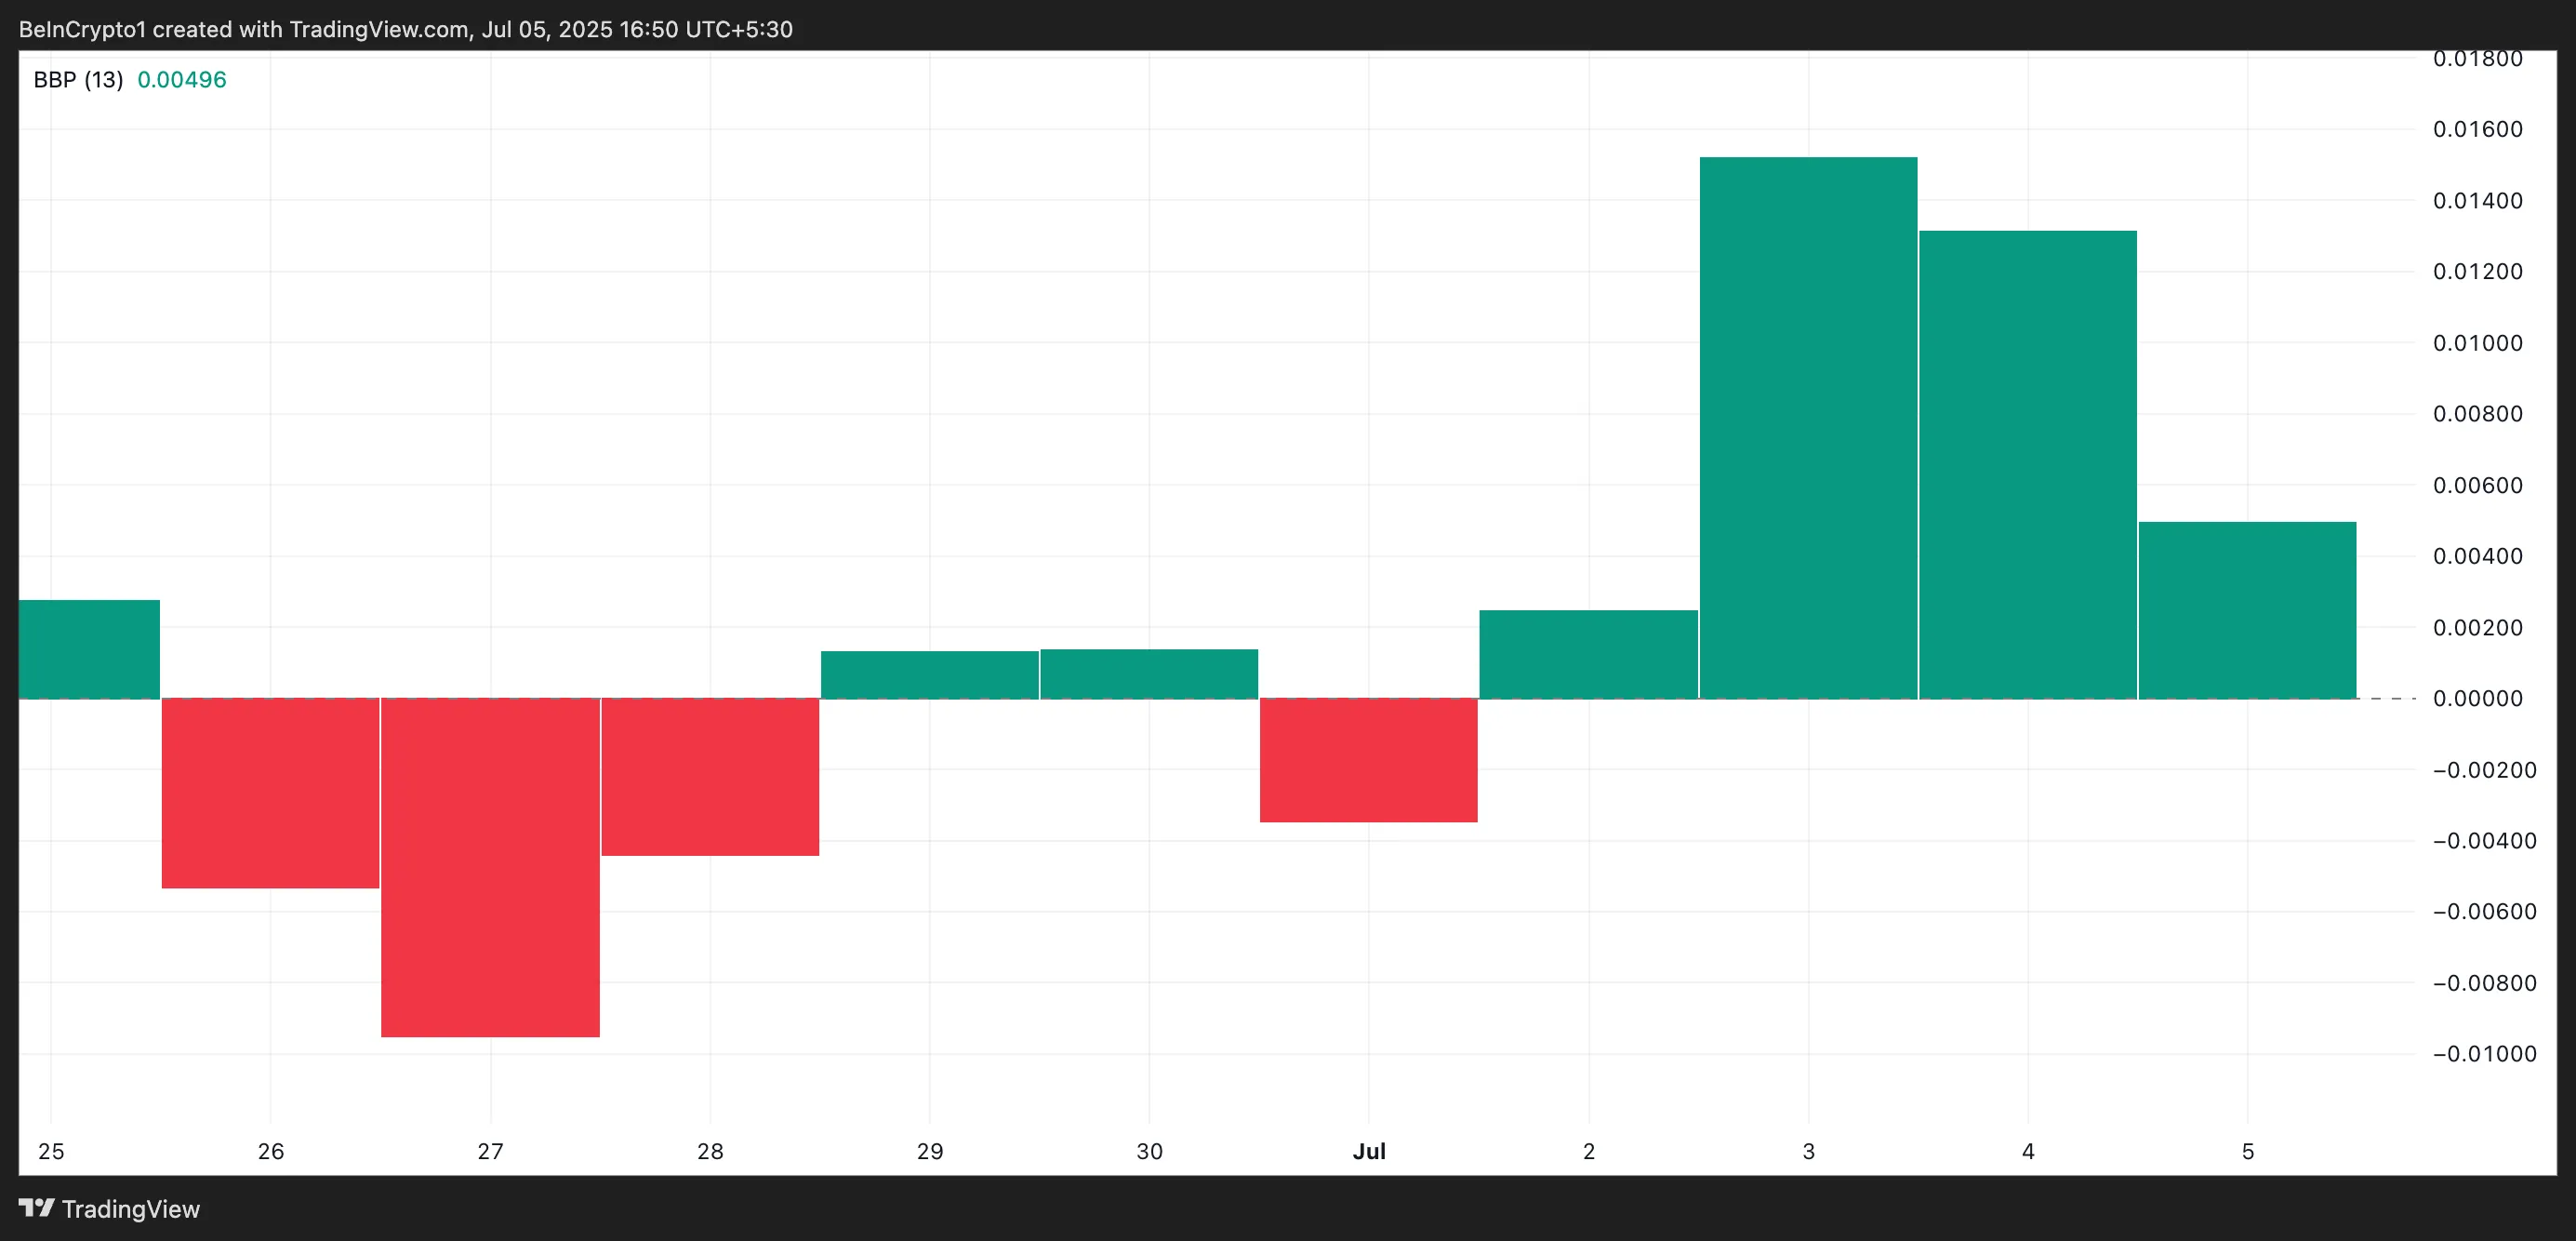
The Elder-Ray Index measures market strength between buyers and sellers. Contracting green bars, as seen with HBAR, indicate a decrease in buying pressure.
Fragile Gains and Potential Price Targets
Unless fresh buying momentum emerges, HBAR may struggle to sustain its recent gains. A potential retracement could see the price drop to $0.141. If selling pressure intensifies at this support level, a further decline to $0.124 is possible.
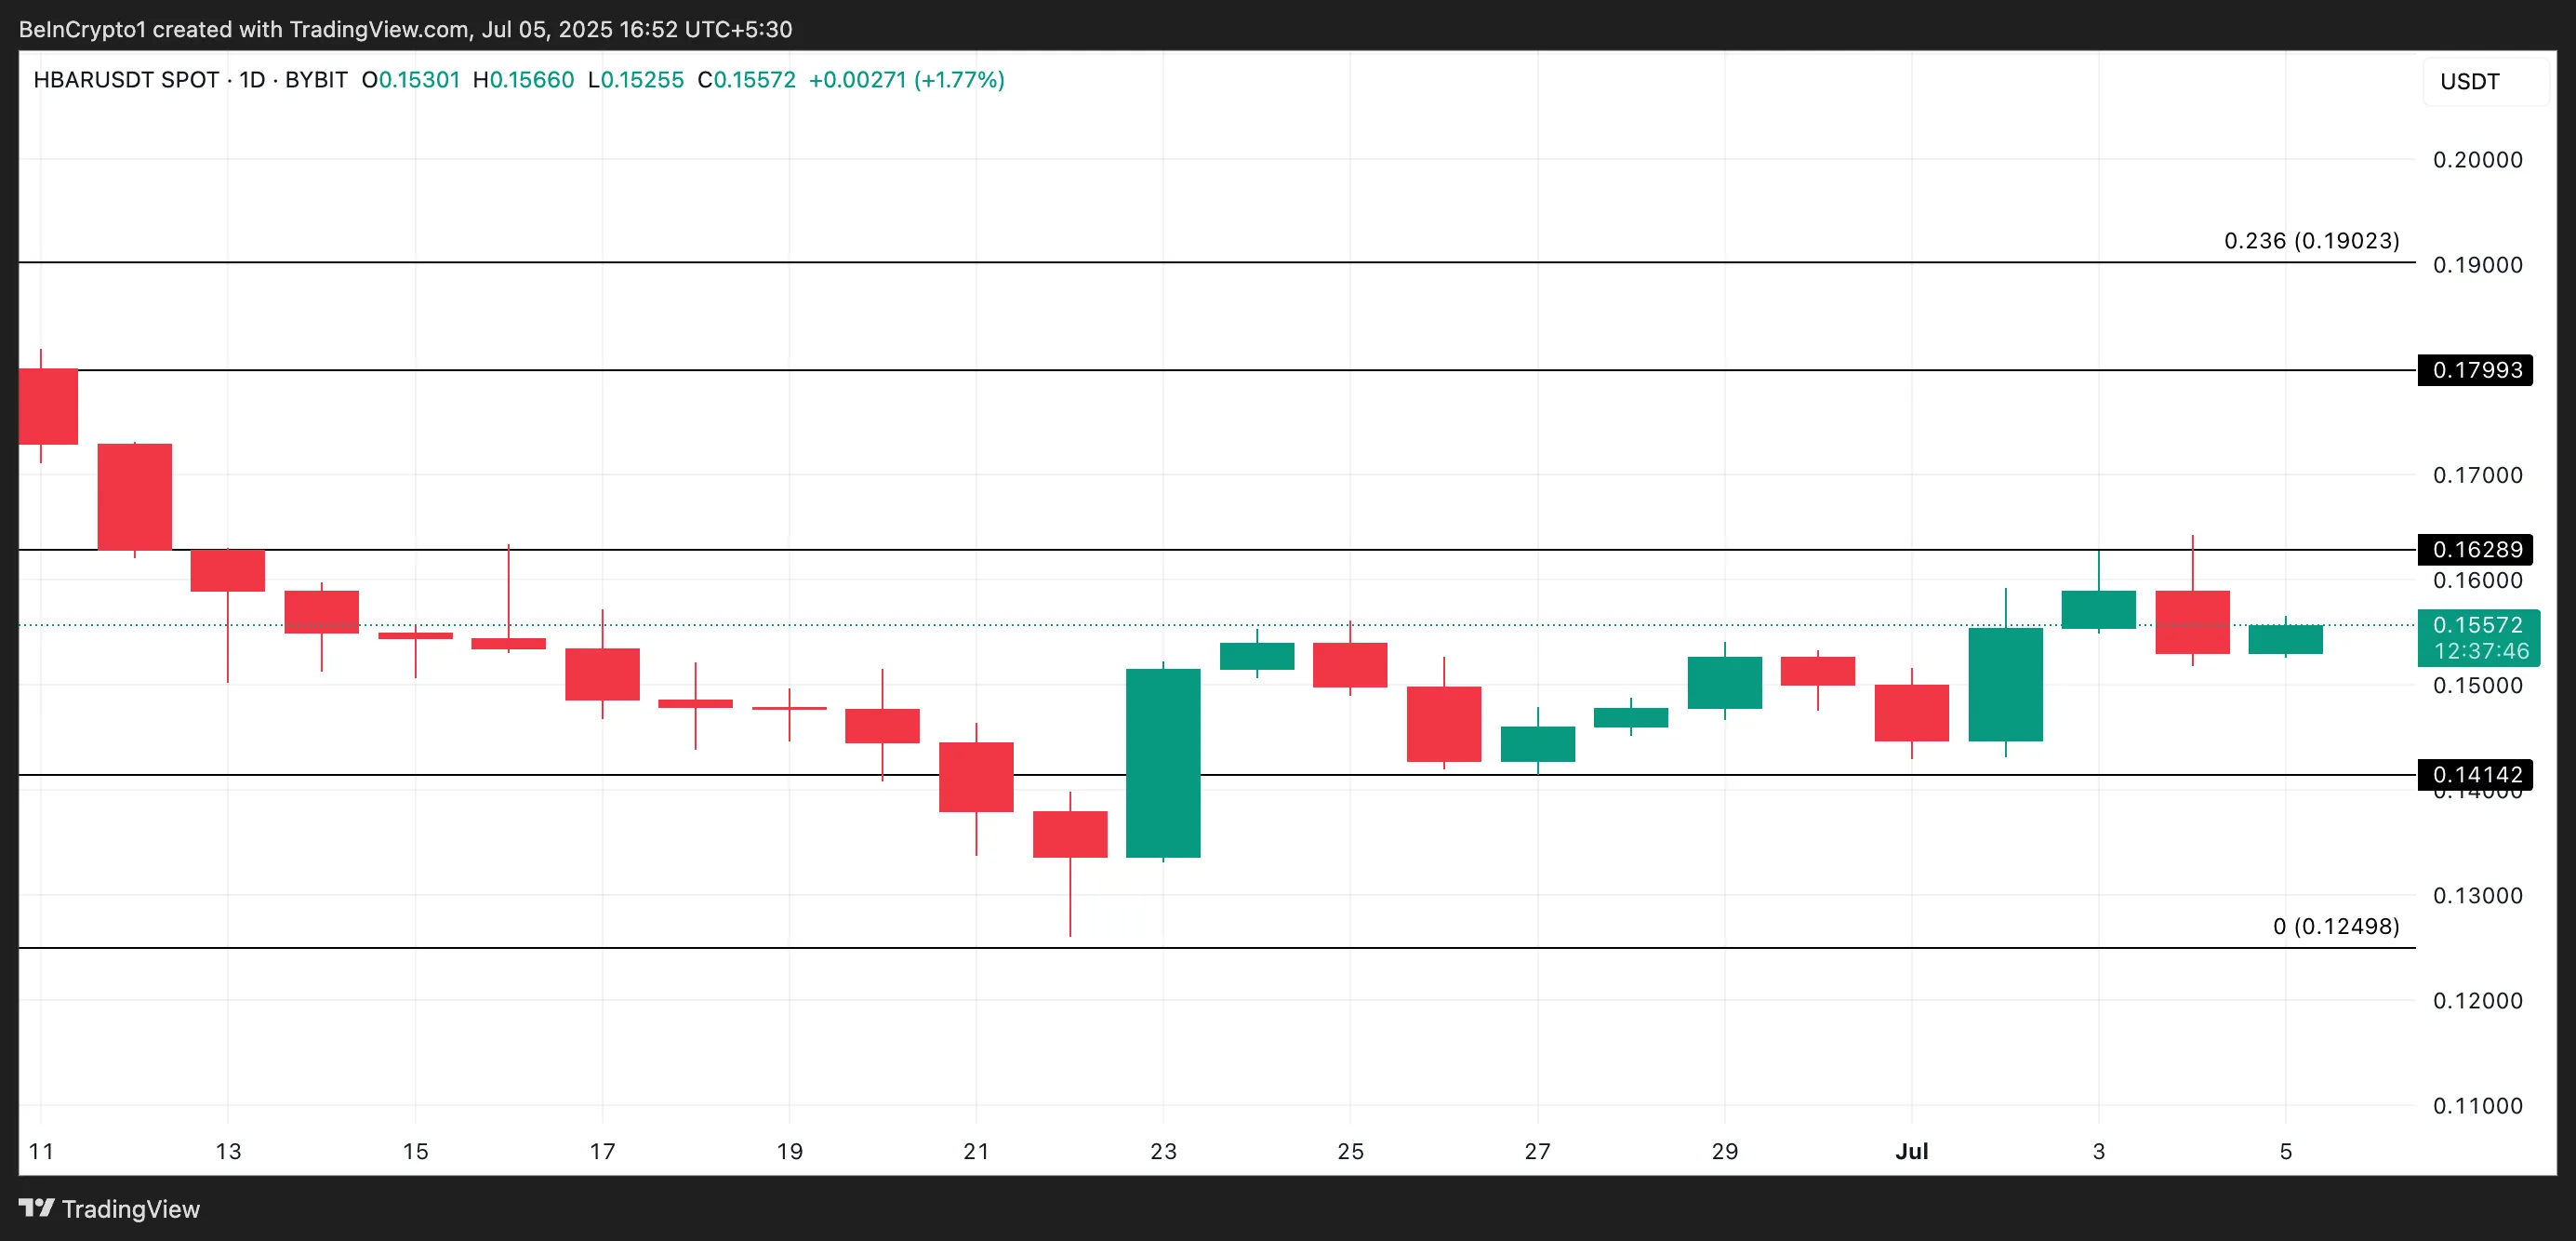
Conversely, a surge in buying could reverse this bearish prediction. Increased demand could push HBAR above $0.162.
Disclaimer: This analysis is for informational purposes only and not financial advice. Market conditions are volatile. Conduct thorough research before making any investment decisions.
Codeum Note: Codeum offers comprehensive blockchain security solutions, including smart contract audits, KYC verification, and custom DApp development, to help mitigate risks within the crypto space. Contact us to discuss your blockchain security needs.